一、SVG概述
SVG是Scalable Vector Graphics的缩写,即缩放式矢量图形;
优点:
- 使用编辑器即可编辑图形
- 基于XML、SVG的图形可以被很容易的搜索,脚本化和压缩
- 缩放不影响图形质量
- 支持随意打印成需要的尺寸
- SVG开源标准
缺点:
- 比正常格式图片体积大
- 即使小图片也可能很大
二、SVG绘制
1.SVG绘制圆形–circle
- circle:绘制SVG圆形标签
- cx/cy:定义圆形中心点
- r:定义圆形半径
- stroke:定义描边颜色
- stroke-width:定义描边宽度
- fill:定义内填充颜色
1
2
3
| <svg width="100" height="100">
<circle cx="50" cy="50" r="45" stroke="orange" stroke-width="10" fill="#ff5" />
</svg>
|

2.SVG绘制矩形和圆角矩形–rect
- rect:绘制矩形标签
- x:矩形的左侧位置,定义矩形到
<svg>左侧的距离是Xpx;
- y:矩形的顶端位置
- rx/ry:圆角半径
style:
1.fill:填充颜色
2.fill-opacity:填充颜色透明度
3.stroke:描边颜色
4.stroke-width:描边宽度
5.stroke-opacity:描边透明度
1
2
3
4
| <svg width="500" height="400">
<rect x="10" y="10" width="300" height="150" style="fill:#ccc; stroke:orange; stroke-width:5px;" />
<rect x="10" y="210" rx="50" ry="100" width="300" height="150" style="fill:#ccc; stroke:orange; stroke-width:5px; stroke-opacity:.5; fill-opacity:.9;" />
</svg>
|

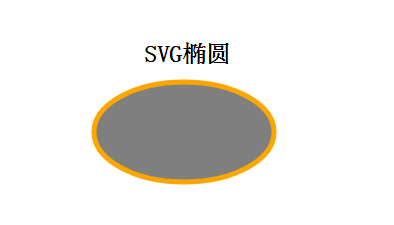
3.SVG绘制椭圆–ellipse
- ellipse:绘制椭圆标签
- cx:定义椭圆中心的X坐标
- cy:定义椭圆中心的Y坐标
- rx:定义椭圆的水平半径
- ry:定义椭圆的垂直半径
1
2
3
4
| <svg width="500" height="400">
<ellipse cx="150" cy="100" rx="90" ry="50" stroke="orange" stroke-width="5" fill="#000" fill-opacity=".5" />
<text x="110" y="30" font-size="24" font-weight="bold">SVG椭圆</text>
</svg>
|
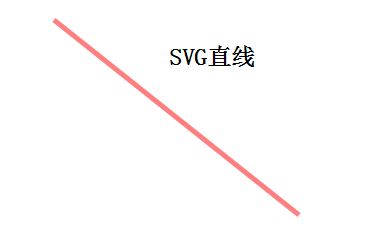
4.SVG绘制直线–line
- line:绘制直线
- x1:直线起点X坐标
- y1:直线起点y坐标
- x2:直线终点x坐标
- y2:直线终点y坐标
1
2
3
4
| <svg width="500" height="400">
<line x1="5" y1="5" x2="250" y2="200" style="stroke:rgba(255, 0, 0, .5); stroke-width:5px;" />
<text x="120" y="50" font-size="24" font-weight="bold">SVG直线</text>
</svg>
|
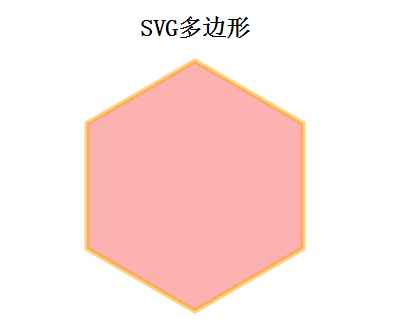
5.SVG绘制多边形–polygon
- polygon:绘制多边形标签
- points:定义多边形每个顶点的X坐标和Y坐标
1
2
3
4
| <svg width="500" height="400">
<polygon points="150, 75 258, 137.5 258, 262.5 150, 325 42, 262.6 42, 137.5" stroke="orange" stroke-width="5" stroke-opacity=".5" fill="rgba(250, 0, 0, .3)" />
<text x="95" y="50" font-size="24" font-weight="bold">SVG多边形</text>
</svg>
|
6.SVG绘制折线–polyline
- polyline:绘制折线标签
- points:定义折线的各个转折点的x坐标和y坐标
1
2
3
4
| <svg width="500" height="400">
<polyline points="150,75 258,137.5 258,262.5 150,325 42,262.6 42,137.5" stroke="orange" stroke-width="5" fill="none"/>
<text x="103" y="50" font-size="24" font-weight="bold">SVG折线</text>
</svg>
|

7.SVG绘制路径–path
路径绘制是SVG图形绘制中比较强大的元素
- path:绘制路径标签
- 相关d属性的说明:
1.M = Moveto:移动到坐标
2.L = Lineto:绘制直线到坐标
3.H = Horizontal Lineto:绘制水平直线到坐标
4.V = Vertical lineto:绘制垂直直线到坐标
5.C = Curveto:绘制曲线到坐标
6.S = Smooth curveto:绘制光滑曲线到坐标
7.Q = Quadratic Bezier curve:绘制贝塞尔曲线到坐标
8.T = smooth quadratic Bezier curveto:绘制光滑贝塞尔曲线到坐标
9.A = elliptical Arc:绘制椭圆弧到坐标
10.Z = closepath:闭合路径
1
2
3
4
| <svg width="500" height="400">
<path d="M 100 100 L 300 100 L 200 300 z" style="fill:orange; stroke:#666; stroke-width:5px;" />
<text x="150" y="80" font-size="24" font-weight="bold">SVG路径</text>
</svg>
|

8.SVG生成文字–text
- text:绘制文字标签
- x:文字的x坐标
- y:文字的y坐标
- dx:x轴偏移坐标
- dy:y轴便宜坐标
- rotate:所有文字渲染角度
- textlength:渲染的文字所占据长度(可用来设置文字间距)
- lengthAdjust:使用何种方式来渲染文字占据长度
1
2
3
4
5
6
7
8
9
| <svg width="500" height="400">
<text x="170" y="80" font-size="24" font-weight="bold">SVG文字</text>
<text x="130" y="120" rotate=" 45" textlength="150" font-size="20" font-weight="bold">文字旋转45度</text>
<a href="http://www.cnblogs.com/yizihan">
<text x="30" y="180" fill="orange" textlength="350" font-size="20" font-weight="bold">
http:
</text>
</a>
</svg>
|

9.SVG绘制描边–stroke
- g:代表一组
- path:绘制路径
- stroke-width:设置描边粗细
- stroke-linecap:设置描边的末端样式
- stroke-dasharray:设置虚线的格式
1
2
3
4
5
6
7
8
9
10
11
12
13
14
15
16
17
18
| <svg width="500" height="400">
<g>
<text x="30" y="30" font-size="20" font-weight="bold">stroke例子</text>
<path stroke="orange" stroke-width="10" d="M 50 50 L 300 50" />
</g>
<g>
<text x="30" y="130" font-size="20" font-weight="bold">stroke linecap</text>
<path stroke="orange" stroke-linecap="butt" stroke-width="10" d="M 50 150 L 300 150" />
<path stroke="orange" stroke-linecap="round" stroke-width="10" d="M 50 180 L 300 180" />
<path stroke="orange" stroke-linecap="square" stroke-width="10" d="M 50 210 L 300 210" />
</g>
<g>
<text x="30" y="280" font-size="20" font-weight="bold">stroke dasharray</text>
<path stroke="orange" stroke-dasharray="5, 5" stroke-width="10" d="M 50 300 L 300 300" />
<path stroke="orange" stroke-dasharray="15, 15" stroke-width="10" d="M 50 330 L 300 330" />
<path stroke="orange" stroke-dasharray="55, 55" stroke-width="10" d="M 50 360 L 300 360" />
</g>
</svg>
|

10.SVG生成滤镜效果
1
2
3
4
5
6
7
8
9
10
11
12
13
|
<defs>
<filter id="myfilter" x="0" y="0" >
<feGaussianBlur in="SourceGraphic" stdDeviation="5" />
</filter>
</defs>
<rect x="30" y="30" width="200" height="100" stroke="green" stroke-width="10" fill="orange" filter="url(#myfilter)" />
|

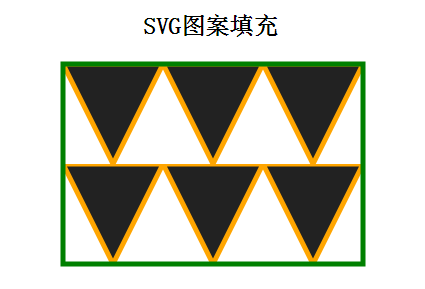
11.SVG生成图案填充效果
1
2
3
4
5
6
7
8
9
| <defs>
<pattern id="mypattern" patternUnits="userSpaceOnUse" x="10" y="10" width="100" height="100">
<path d="M 0 0 L 100 0 L 50 100 z" fill="#222" stroke="orange" stroke-width="5" />
</pattern>
</defs>
<rect x="10" y="10" width="300" height="200" stroke="green" stroke-width="5" fill="url(#mypattern)" />
|
12.SVG生成渐变效果
1
2
3
4
5
6
7
8
9
10
11
12
13
14
15
16
17
18
19
20
21
| <svg width="500" height="400">
<defs>
<linearGradient id="linearGradient">
<stop offset="0%" stop-color="#f00" />
<stop offset="100" stop-color="#f60" />
</linearGradient>
</defs>
<rect x="10" y="10" width="300" height="100" stroke="orange" stroke-width="5" fill="url(#linearGradient)" />
<defs>
<radialGradient id="radialGradient">
<stop offset="0%" stop-color="#f00" />
<stop offset="100%" stop-color="#f60" />
</radialGradient>
</defs>
<rect x="10" y="150" width="100" height="100" stroke="orange" stroke-width="5" fill="url(#radialGradient)" />
</svg>
|

13.JS添加互动操作到SVG图形
1
2
3
4
5
6
7
8
9
10
11
| <svg width="500" height="400">
<rect id="myrect" x="50" y="50" width="200" height="200" fill="orange" onClick="showcolor()" />
</svg>
<script>
function showcolor(){
var color = document.getElementById('myrect').getAttributeNS(null,'fill');
alert('矩形填充色为:' + color);
}
</script>
|
14.SVG图形中添加超链接
1
2
3
4
5
| <svg width="500" height="400">
<a xlink:href="http://www.cnblogs.com/yizihan/" >
<rect x="10" y="10" width="200" height="200" style="fill:orange; stroke-width:5; stroke:rgb(222, 0, 0)" />
</a>
</svg>
|